Live Rates

Saturday, 16 April 2016

Your Trading Journal


                       OPEN YOUR PORTFOLIO MANAGEMENT ACCOUNT NOW,                         LET THE CYSEC LICENCED EXPERTS TRADE FOR YOU.


Example of How to Write a Forex Journal

Track all your trades in a Forex journal . By following this simple, easy to follow tip, you can easily improve your trading. Here is how you do it:

Step 1 - Write down WHY you are making a trade BEFORE opening a transaction.

Before opening a position, write in a journal the reasons why you are making the transaction. It doesn't have to be long; it doesn't even have to be in complete sentences. Just write a few key reasons why you are making this transaction.


Be honest with this journal. If you are honest, it will prevent you from making the biggest mistakes of your trading career. If you see that you are making the transaction because of anything other than a sound Forex strategy. DO NOT MAKE THE TRANSACTION!

If you make a losing trade, do not open another transaction immediately so as to make profits to neutralize the losses you have made, this is known as revenge trading, do not revenge against the market. Shut off the computer, walk away, and take a cold shower. Remember that you will never lose money that you don't put in. A winning Forex strategy is not only about how much you win, but how much you don't lose.


Step 2 - Write down how you will exit the trade BEFORE making the transaction.
Do not get trapped with a great entry strategy without an exit strategy. Your strategy should have both great entry and exit strategies. One is useless without the other.

But you ask, Why bother? I know my exit strategy. Why do I have to write it down?

Well, the reason is this: humans are at best irrational, impulsive, and emotional creatures. If you have your exit strategy written down, you have a frame of reference when you exit a position. You will refer to your journal BEFORE exiting a transaction. If you are selling for any reason other than your original exit strategy, you must ask yourself why?

Your journal will save you more money than you can imagine. It will prevent you from making impulsive moves, which is usually why people lose money.

Step 3 - Write down why you exited the position.
This should be the same reason that you wrote down in step 2. If it is not, it is up to you to analyze it. The most common reason why people deviate from their strategy is the lack of discipline. Your journal will be looking back at you with glaring evidence of exactly why you are not a winning Forex investor.

STEP 4 - ANALYZE THE RESULTS

You must learn from your mistakes. This is the best way for anyone to improve their profits. Everybody makes mistakes, but the great traders are able to learn from them and not repeat.

And the best way to learn from your mistakes is to document them in a journal. A few years down the road, you can still look back and realize that you are still making the same errors you were when you first began.


This information can not be found in any book or seminar. Your journal is personal and is uniquely you. Your personality will determine the type of investor you will become, and will also determine the type of mistakes you will make.

Not only does your journal highlight your weaknesses, it will reveal the transaction that is the most profitable. After a little while, you will see the type of setups that make you the most money, and a pattern will emerge. Do not let this information on your Forex journal go to waste.

You should do every effort to understand why those transactions went well and try to replicate it as often as possible. Profitable traders know their strengths and weaknesses. They play on their strengths and try to minimize their weakness.

Do not get lazy and forget to write in your journal . Documenting your thought process is the fastest and surest way to get better at Forex. Do this consistently, and you will learn more about your habits than you can imagine.

Your goal is to identify and break the bad habits as soon as possible. If you notice that you always hang on to a losing transaction too long, you should do everything in your power to prevent this from happening again.

Summary

Your journal is gold. It contains a wealth of information that will play a vital role in your success as an investor.

we strongly urge you to use it for at least one month. If it has not helped improve your profits in thirty days, then feel free to stop.

But be sure to try it before deciding not to. It may be just the tool needed to push your trading to the next level to becoming a successful investor.


Writing a Journal Example Template

The following is an example template that an investor can use to come up with their own template for writing their own:

Date - Friday 22 August


Page 1

EURUSD - Short Sell 
Day
  • Day trend is short sell, RSI 33
  • Volatility is high Bollinger bands pointing down
  • Price was retracing but downtrend is still intact confirmed by RSI, market has resumed down direction
4H
Price is moving down indicated by MA down crossovers, Relative Strength Index at 46 moving downwards, volatility is low.

1H
MA are moving down, Relative Strength Index at 34, volatility is medium and the price is below middle Bollinger band.

Enter Short Sell based on trend for the daily chart which is short, RSI 33 and also all entry signals for H1 have been met.
Take Profit- at 100 pips between support1 and support2
Profit by Market Close: +33 pips

Why Trade Was Profitable
1H- MA for 1 hour heading down all day, MACD gave a sell signal after leaving overbought, RSI less than 50 and the price action direction on H1 was down, volatility was medium and Bollinger bands were pointing down.

Day- The daily MA were crossing over to signal a long trend but was a non-confirmation since the MACD showed short, RSI at 32, therefore this was just a retracement, the trade was opened when the price started to come down this was just a retracement.

4H- The retracement was already complete and the and the MA crossover system had already given a down crossover signal, Relative Strength Index was heading down and MACD also gave a short signal.
Page 2
USDCHF- Buy Long
Day
The trend is upwards based on RSI at 65 and MAs are flat, Bollinger bands are wide pointing up, volatility is high.

4H
Relative Strength Index at 50, stochastics leaving oversold, MA crossover has given an uptrend crossover signal.

1H
MA moving up, RSI at 64, stochastics heading upwards

Enter Long based on daily chart and all buy long signals have been met
Profit at Market close +45 pips

Why Transaction Was Profitable
H1- Ma for H1 headed up all day, MACD gave a buy signal after coming up from oversold, RSI was above 50 all day, volatility high and Bollinger bands going upwards.

Day- the daily MACD was bullish, the RSI was at 68 heading upwards, the market was retracing but had already started turning up, volatility was high with Bollinger bands heading up.

4H- Ma had an upward crossover signal, the Relative Strength Index was heading upwards, the MACD was above zero centerline mark, volatility was low.

Page 3

GBPUSD- Short Sell
Day
Day trend is short,RSI is at 23, the market has resumed downtrend after a retracement, big black Marubozu candlestick pattern.

4H
Price has turned down after retracement, RSI at 38, stochastics leaving overbought heading down and Moving Average Crossover system has given a short sell signal heading down.
GDP for Britain came out worse than expected, GBP Fundamentals and Technical Analysis = downtrend

Entry- Short based on Day and all sell signals rules on the 1H have been met
Profit at close +35 pips

Why Trade Was Profitable
1H- MA were heading down all day in a steep manner, the MACD had left overbought giving a sell signal all day, RSI stayed low at around 30, Fundamental indicators came out extremely bearish, volatility was high and Bollinger bands were pointing down.

Day- The Daily MA were to crossover but because of the retracement, headed right down again with a big black candle(250 pips), MACD was bearish, RSI at 22heading down and Bollinger bands pointing down, volatility was high.

4H- 4 hours chart the moving average had given a down crossover signal, MACD was below zero center line mark, Relative Strength Index was below 50.

Page 4

USDJPY- Buy Long
Day
The day trend is upwards, RSI at 52, stochastics heading upward and MA pointing sideways, the market has resumed upward direction after the retracement.

4H
MAs going upwards, stochastics leaving oversold region, RSI at 52

1H
MAs going up, RSI at 65, both stochastic heading upwards

Entry- Long based on Daily and all buy signals rules on the 1H have been met
Profit at close +64 pips

Why Transaction Was Profitable
H1- MAs were moving up all day, MACD gave a buy signal, RSI was above 50 volatility was high and Bollinger bands were pointing upwards.

Day- MACD was in bullish territory above zero center line, RSI was below 50 but pointing upwards, the MA were flat, Bollinger bands were pointing upwards and volatility was low.

4H- on the 4-hour chart, the moving averages had given a buy crossover signal, Relative Strength Index at 51 after crossing above the 50 centerline mark.

Profit at Market Close

EURUSD +33 Pips
USDCHF +45 Pips
GBPUSD +35 Pips
USDJPY +64 Pips
Total =  177 Pips

Why trades were profitable

Why transactions were profitable is because multiple time-frames analysis were used correctly and the direction of the price action was analyzed correctly by following the rules of my system as specified in the Forex plan.

Entry Rules in the 1 Hour timeframe had matched before opening of these orders

Fundamental Indicators were also used to predict some moves.

In Short - Today I stuck to all the rules of my system
                              OPEN YOUR PORTFOLIO MANAGEMENT ACCOUNT NOW,
                                LET THE CYSEC LICENCED EXPERTS TRADE FOR YOU.


Record Entries Explained Using Examples with Images


1.

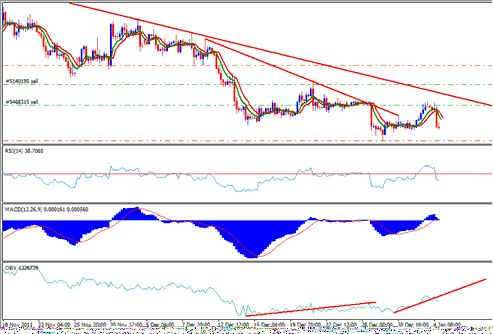
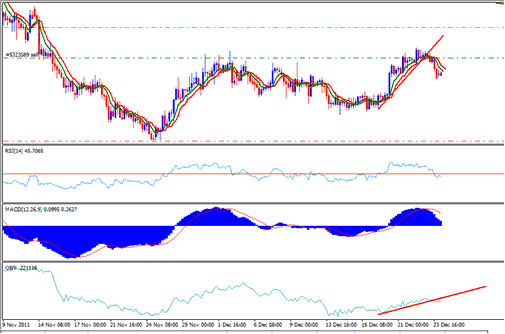
EURJPY Sell Position 13-December-2011

Position opened EURJPY Short Sell
Date: 12-13-2011

Chart Timeframe: 4 hr Chart
Why Transaction was opened
  • Both MAs were moving downwards
  • Relative Strength Index is below 50 Level, therefore, the currency is bearish
  • MACD is heading towards Bearish Territory
  • OBV has broken the upward trend line, therefore, direction is downward

The price is also touching the downward trend line, therefore, this would be a good place to sell the currency.
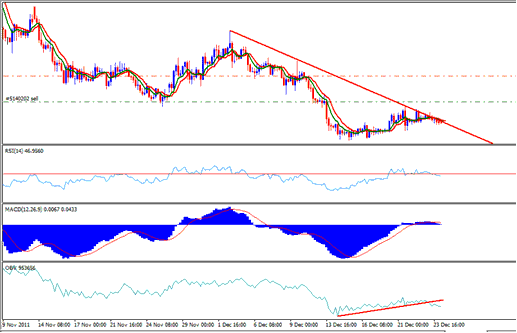
EURJPY Sell Position

Closed
Closed by Taking Profit 300 Pips
Date: 01-02-2012
EURJPY Close Position

Why this position was profitable
It was profitable because the risk to reward ratio of this setup was very high.

The trade went back to its downwards after touching the downward trend line.

The OBV indicator is a leading indicator and when it broke its upward trend line it meant the price was going to go downwards.

After this leading signal, all the signals turned to show a bearish momentum and a bearish market.


2.

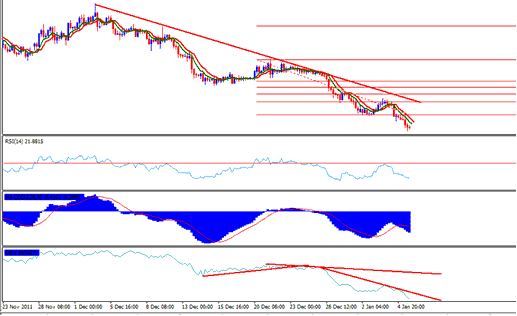
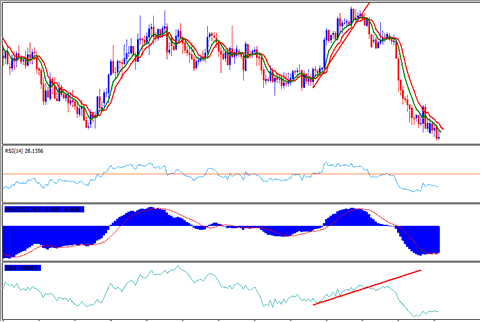
EURUSD Short Sell - 13-December-2011

EURUSD Short Sell Signal
Date: 12-13-2011

Why Transaction was Opened
  • Both of the MAs were heading downwards
  • Relative Strength Index indicator is below 50 center line level
  • MACD is heading downwards
  • OBV indicator has broken its upward trend line
EURUSD Sell Trade

Closed
Closed by Take Profit 300 pips
Date: 01-05-2012

Why the transaction was profitable
All the rules of our system were followed before entering the short sell.
The long-term price action direction of the EURUSD is downwards as shown by the downwards trend lines.


Technical Analysis
There was a rally of the EURUSD which only went up to the previous resistance level, a good place to sell again. From the above diagram the first transaction has taken profit, the second one is still continuing.
Close EURUSD Sell Trade
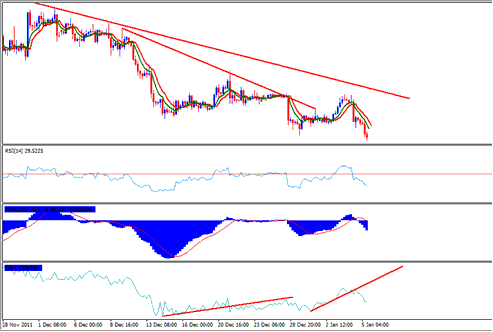
EURUSD Closed by Take Profit


3.

GBPUSD Short Sell - December-20-2011

Date: 20.12.2011
Position Opened – GBPUSD Short
Time-frame – 4-hour chart

Why Transaction was opened
  1. Both MAs are moving down
  2. RSI is below the 50 center-line mark
  3. MACD is heading down
  4. OBV has broken the upward trend and the market now is bearish.

    A downward trend line can also be plotted on the price chart. This shows that rules of our system have been met and the market is bearish.
    GBPUSD Short Sell Trade
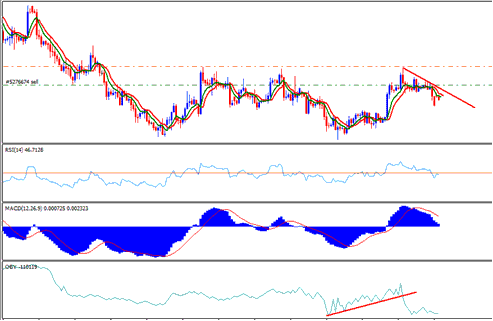
    Take Profit – 300 pips
    Stop Loss - 100 pips

    Take Profit Hit
    Closed by take profit
    Date: 29.12.2011


    Why This Position was Profitable:
    All rules for the system were met before opening the transaction.
    GBPUSD Take Profit
    GBPUSD after hitting take profit.


    4.

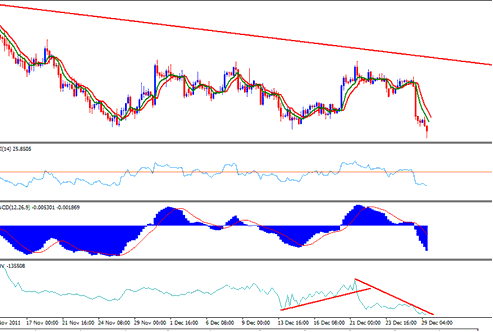
    GBPJPY Sell - December-22-2011

    Date: 22-12-2012
    Opened: GBPJPY Short Sell
    Time-frame: 4 hr chart time frame

    Why the transaction was opened
    1. Both Moving averages moving down
    2. Relative Strength Index indicator below 50 center line level
    3. MACD indicator is heading down
    4. OBV has broken upward trend line meaning price will soon follow.

    Since volumes always precedes price the price will break the upward trend line and start to move downwards. In addition, the longer-term price direction is a downward.
    GBPJPY Sell Trade

    Closed

    Closed by take profit (300 pips)
    Date: 01-02-2012

    Why This position was profitable
    The long term trend is a downward.
    All the rules of the system were followed before opening the position.
    GBPJPY Take Profit
    GBPJPY short sell closed after take profit.

    Tuesday, 12 April 2016

    Islamic Swap Free Account

                 
    OPEN LIVE ACCOUNT


    OPEN YOUR PORTFOLIO MANAGEMENT ACCOUNT NOW,
     LET THE CYSEC LICENCED EXPERTS TRADE FOR YOU.
    In Forex, there is the payment of swaps every day; this is the interest rate of a currency that the currency earns per day. This interest for a currency like theAustralian Dollar is 5%, this means that every day a fraction of this five percent is paid to anyone holding this Australian Dollar.

    This brings the Issue of paying and getting paid interest which is an Issue in Islamic Religion. Islamic Religion does not allow paying and getting paid interest, For Islamic currency traders there is an account designed in accordance with their Values; Known as Swap Free.

    For this account a trader will not pay the overnight rollover interest on any currency and will also net get paid any interest, this is also known Shariah Compliant where there is no paying of RIBA (interest) - also referred to as Islamic Accounts.

    For a trader to get a swap free account, a trader has to go to a broker and select the option of “Islamic Account”, This option is provided under the Accounts Section of the currency broker specifying the instructions of opening one of these accounts.

    Once a trader opens this account, then the Forex rollover interest is removed. Once this no paying of interests is set, if a trader is using a trading platform such as the MetaTrader 4 then the rollover fee record will be set to zero.
    The rollover fee is charged daily at the end of the trading day for those holding a particular currency for which a swap is to be applied. As a trader if you do not want to pay this  rollover you should close your trades before the end of the day, that way you will not pay the rollover fee as you are no longer holding the currencies. Because the currency market does not open on Saturday and Sunday, the rollover for this 2 day will be charged on Wednesdays, meaning on Wednesday one will pay the rollover for Wednesday, Saturday, and Sunday, and therefore on Wednesdays this rollover fee is paid 3 Times.

    These positions that pay a rollover interest are commonly referred to by traders as Overnight Positions. Day Traders rarely leave their trades opened overnight and close them all before the end of the day. Swing Traders, on the other hand, may leave their trades opened for a few days and leave these trades overnight so as to capture more movement in the price trend.

    Once a trader finds a swap free Forex broker and opens and Islamic Account, the trader will have the same trading conditions as those of other traders, except for the paying of rollover fees. This means a trader will use the MetaTrader 4 Platform like all the other traders, the trader can trade all currencies, all indices, all CFDs, all metals and all other Financial Instruments provided by the broker.

    However, be careful in selecting a swap free broker, some brokers will add a commission or add some pips to the spread you trade with to cover the swap(Swap Fee Broker). This is not supposed to happen as the trader will still be paying for the interest even though is disguised as another charge, good Brokers do not add any commission nor do they add any charge on to the spreads.

    Another thing is that some brokers will charge a rollover fee if the position held by a trader is held for more than 5 days or more than 7 days, this should not be the case and the broker should not charge any carry over interest even if the open positions are held for more than five or seven days. For traders wanting to open this swap free Account it is good to check for any additional terms of trading for the Islamic Account that you are going to be opening to make sure that the broker you choose is really a
    no swap broker.
                                 Islamic Investment Forex Trading Account - Swap Free Account
                                OPEN YOUR PORTFOLIO MANAGEMENT ACCOUNT NOW 

    Wednesday, 6 April 2016

    FOMC Minutes to Validate Fed and Markets on US Rate Hikes

    Stop trying luck, FX trading is an emotional Sport driven by skills.

                                                                          Learn it.   
    ----------------------------------------------------------------------------------------------------------------------------------
    After hiking at the end of 2015 the Fed has now lowered Expectations to 2 Raises in 2016
    The USD recorded the worst quarterly performance since 2010 as Fedspeak and Fedfacts have clashed. The March Federal Open Market Committee (FOMC) disappointed with its dovish tone, specially after the European Central Bank (ECB) had gone all out on its quantitative easing (QE) push earlier in the month. Fed member hawkish remarks reversed the USD down trend, only to be brought down to earth after Fed Chair Yellen’s speech at Economic Club of New York.
    The release of the March FOMC minutes could put further downward pressure on the USD when they are published on Wednesday, April 6 at 2:00 pm EDT. Comments from Federal Reserve Bank of Kansas City President Esther L. George will be actively searched as she was the only dissenter on the vote to hold interest rates unchanged.
    Fed facts and official statements have stressed the caution with which the central bank will approach the decision to raise rates in the future. That patient stance has made the market punish the USD versus other pairs as it is unlikely there will be more than 2 rate hikes in 2016, when at the end of 2015 the expectation backed by Fed forecasts was double that.

    The EUR/USD had a 0.10 percent loss in the last 24 hours. The USD advanced slightly ahead of the release of the March Federal Open Market Committee (FOMC) meeting minutes. The USD has been able to gain as investors looks for safety and close long positions ahead of the uncertain comments from Fed members on the U.S. economy and the effects of a global slowdown are having on growth.
    Commodity currencies were hit by the risk off move combined with the uncertainty surrounding the energy market. The Doha summit has been mostly a source of stability for the volatile price of energy, but comments from Organization of the Petroleum Exporting Countries (OPEC) and non-OPEC nations has raised doubts about the oil output freeze agreement to be signed on April 17. Saudi Arabia and Iran continue at the heart of the disagreement.

    The CME Fed Watch Tool is showing that the market and the Fed agree on a limited rate hike outlook. The September FOMC is a likely candidate for a rate hike with 40 percent of a rate hike. June and December are also in the running as they feature a press conference following the publication of the Fed Funds rate statement.
    Countdown to FOMC - CME Group
    The CME Fed Watch tool has a 18 percent for June and 57 percent for December. Going by past Fed behaviour June is probably too early and the central bank would be acting with a limited data set. The main challenge with September is the proximity of the November U.S. presidential election and the risk of a rate hike seen as biased to a particular candidate. December then becomes the most probably choice, but remains to be seen if the U.S. economy will be ready by then, so far the Fed can afford to be patient and has said through its member’s statements that it could let inflation run hot before raising rates.
    USD events to watch this week:
    Wednesday, April 6
    10:30am USD Crude Oil Inventories
    2:00pm USD FOMC Meeting Minutes
    Thursday, April 7
    8:30am USD Unemployment Claims
    Tentative EUR ECB President Draghi Speaks
    5:30pm USD Fed Chair Yellen Speaks
    Friday, April 8
    4:30am GBP Manufacturing Production m/m
    8:30am CAD Employment Change
    8:30am CAD Unemployment Rate
    *All times EDT
    Happy Trading.


    Monday, 4 April 2016

    Ego and Success

                                                         
     OPEN LIVE ACCOUNT

    CYSEC Licensed Portfolio Managers Ready to serve Nigerians

                                Stop trying luck, FX trading is an emotional Sport driven by skills.                      

    Email us @admin@emalbansfx.com for details.


    When entering a trade, a trader is always optimistic, certain that the market will prove them right and there is no doubt in their mind that their analysis is correct.
    If or when the market turns against them, a trader’s ego can be a dangerous weakness.  You see, the market can move in a direction opposite to a trader’s prediction for a lot longer than a trader can remain solvent (or sane) and a trader with a high ego may continue to think he is right about his analysis even when the market persists to travel in a direction opposite to the trader’s prediction.
    How do you fight your trader’s optimism?
    Know upfront that even successful traders can be profitable when only correct about maybe 50% of their trades, so when planning a trade, think of the worst case scenario, and set your Stop Loss levels with a pessimistic outlook in mind.
    Learn that successful traders profit from not limiting their upside risk, rather than their downside risk. This means that great investors know to cut their losses short and do not get anxious when winning, looking to cash their profits early.
    Having a thorough risk management plan is crucial to a successful trading strategy and planning with the knowledge that you won’t always be right, no matter how much you think you will be, can help you react correctly when you experience a loss. Keeping your ego under control can help you achieve overall trading success. 
    Happy Trading. 
       

    7 Major Event for the week 4th to 8th April, 2016.

     OPEN LIVE ACCOUNT

    CYSEC Licensed Portfolio Managers Ready to serve Nigerians Stop trying luck, FX trading is an emotional Sport driven by skills.                      Email us @ admin@emalbansfx.com for details.


    The US dollar was hit hard by Yelle’s dovish tone and the recovery was limited. Yellen has another opportunity to move the greenback in the upcoming week. In addition, a rate decision in Australia, the US Non-Manufacturing PMI and the FOMC meeting minutes stand out. These are the highlights of this week. Here is an outlook on the coming financial events.
    The Non-Farm Payrolls report showed US economy gained 215,000 jobs in March, reaffirming the strength of the labor market, despite recent economic headwinds. The reading was higher than the 206,000 forecast but not enough to maintain February’s low unemployment rate which increased to 5.0%. Nevertheless average hourly earnings edged up 7% representing a 2.3 percent annualized again. The retail sector showed the biggest increase with 48,000 new jobs, while construction and health care added 37,000 each. The report was very good but it is unlikely that it would change the Fed’s decision to postpone its rate hike plans. Let’s start,
    Updates:
      1. Australian rate decision: Tuesday, 1:30. The Reserve Bank of Australia kept its cash unchanged at 2% in March, but hinted it may cut rates in the near future. Governor Glenn Stevens reiterated the downside risks in low inflation noting it may induce the RBA to cut rates. The Employment market also concerns the central bank after a surprise jump in the unemployment rate. Furthermore, global market uncertainty raises fears of future growth. Economists expect the RBA will cut interest rates to 1.5% this year.
      2. US ISM Non-Manufacturing PMI: Tuesday, 14:00. The U.S. service sector expanded in February reaching 53.4 a bit lower than the 53.5 posted in the previous month. The reading was higher than the 53.2 figure expected by analysts. Business activity index increased to 57.8 from 53.9 the month before. Employment index fell to 49.7 from 52.1 a month earlier, showing the first decline since February 2014. New orders dropped to 55.5 from 56.5. The prices paid index fell to 45.5 from 46.4.  US service sector is expected to expand further to 54.1 in March.
      3. US Crude Oil Inventories: Wednesday, 14:30. U.S. crude inventories increased 2.3 million barrels in the last week, falling short of the 3.3 million-barrel gain forecasted by analysts. Oil prices were boosted by the weak dollar becoming more attractive to users of the euro and other currencies. OPEC oil output increased in March, amid higher supply from Iran.
      4. US FOMC Meeting Minutes: Wednesday, 18:00. The FOMC minutes from the Fed’s January meeting showed the main topic of concern was the continuing deterioration of global financial and their downside risks to the U.S. economy. On the opposite side, some” members noted that wage pressures had increased. Overall the minutes indicate that an easing in global volatility, together with continued improvement in the domestic labor market and inflation, could bring another rate hike in the following months.
      5. US Unemployment Claims: Thursday, 12:30. The number of new claims for unemployment  aid edged up unexpectedly  last week, but remained below the 300,000 line indicating strong employment market. Claims increased 11,000 to a seasonally adjusted 276,000, higher than the 267,000 forecast. The four-week moving average of claims increased by 3,500 to 263,250 last week. Economists expect nonfarm payrolls to increase 205,000 this month following a 242,000 gain in February. The unemployment rate is expected to remain unchanged at 4.9%. Economists expect 271,000 increase in the number of claims this week.
      6. Janet Yellen speaks: Thursday, 21:30. Fed Chair Janet Yellen will speak in New York at the International House. She may talk about the recent positive employment data and the resilient consumer spending and may also refer to her pessimistic views on Global economy and its downside risks to the US economy. Market volatility is expected.
      7. Canadian employment data: Friday, 12:30. Canada’s employment market contracted unexpectedly in February losing 2,300 jobs raising jobless rate to 7.3%. The unemployment rate climbed to the highest level since March 2013 surprising analysts who had forecast Canada would add almost 10,200 jobs. Most of the job cuts were full-time, losing 52,000 jobs during the month. That figure was partially offset by an increase in part-time work.
      That’s it for the major events this week. *All times are GMT.
      By; ANAT DROR.
       OPEN LIVE ACCOUNT