OPEN YOUR PORTFOLIO MANAGEMENT ACCOUNT NOW, LET THE CYSEC LICENCED EXPERTS TRADE FOR YOU.
Example of How to Write a Forex Journal
Track all your trades in a Forex journal . By following this simple, easy to follow tip, you can easily improve your trading. Here is how you do it:
Step 1 - Write down WHY you are making a trade BEFORE opening a transaction.
Before opening a position, write in a journal the reasons why you are making the transaction. It doesn't have to be long; it doesn't even have to be in complete sentences. Just write a few key reasons why you are making this transaction.
Be honest with this journal. If you are honest, it will prevent you from making the biggest mistakes of your trading career. If you see that you are making the transaction because of anything other than a sound Forex strategy. DO NOT MAKE THE TRANSACTION!
If you make a losing trade, do not open another transaction immediately so as to make profits to neutralize the losses you have made, this is known as revenge trading, do not revenge against the market. Shut off the computer, walk away, and take a cold shower. Remember that you will never lose money that you don't put in. A winning Forex strategy is not only about how much you win, but how much you don't lose.
Step 2 - Write down how you will exit the trade BEFORE making the transaction.
Do not get trapped with a great entry strategy without an exit strategy. Your strategy should have both great entry and exit strategies. One is useless without the other.
But you ask, Why bother? I know my exit strategy. Why do I have to write it down?
Well, the reason is this: humans are at best irrational, impulsive, and emotional creatures. If you have your exit strategy written down, you have a frame of reference when you exit a position. You will refer to your journal BEFORE exiting a transaction. If you are selling for any reason other than your original exit strategy, you must ask yourself why?
Your journal will save you more money than you can imagine. It will prevent you from making impulsive moves, which is usually why people lose money.
Step 3 - Write down why you exited the position.
This should be the same reason that you wrote down in step 2. If it is not, it is up to you to analyze it. The most common reason why people deviate from their strategy is the lack of discipline. Your journal will be looking back at you with glaring evidence of exactly why you are not a winning Forex investor.
STEP 4 - ANALYZE THE RESULTS
You must learn from your mistakes. This is the best way for anyone to improve their profits. Everybody makes mistakes, but the great traders are able to learn from them and not repeat.
And the best way to learn from your mistakes is to document them in a journal. A few years down the road, you can still look back and realize that you are still making the same errors you were when you first began.
This information can not be found in any book or seminar. Your journal is personal and is uniquely you. Your personality will determine the type of investor you will become, and will also determine the type of mistakes you will make.
Not only does your journal highlight your weaknesses, it will reveal the transaction that is the most profitable. After a little while, you will see the type of setups that make you the most money, and a pattern will emerge. Do not let this information on your Forex journal go to waste.
You should do every effort to understand why those transactions went well and try to replicate it as often as possible. Profitable traders know their strengths and weaknesses. They play on their strengths and try to minimize their weakness.
Do not get lazy and forget to write in your journal . Documenting your thought process is the fastest and surest way to get better at Forex. Do this consistently, and you will learn more about your habits than you can imagine.
Your goal is to identify and break the bad habits as soon as possible. If you notice that you always hang on to a losing transaction too long, you should do everything in your power to prevent this from happening again.
Summary
Your journal is gold. It contains a wealth of information that will play a vital role in your success as an investor.
we strongly urge you to use it for at least one month. If it has not helped improve your profits in thirty days, then feel free to stop.
But be sure to try it before deciding not to. It may be just the tool needed to push your trading to the next level to becoming a successful investor.
we strongly urge you to use it for at least one month. If it has not helped improve your profits in thirty days, then feel free to stop.
But be sure to try it before deciding not to. It may be just the tool needed to push your trading to the next level to becoming a successful investor.
Writing a Journal Example Template
The following is an example template that an investor can use to come up with their own template for writing their own:
Date - Friday 22 August
Page 1
EURUSD - Short Sell
Day
- Day trend is short sell, RSI 33
- Volatility is high Bollinger bands pointing down
- Price was retracing but downtrend is still intact confirmed by RSI, market has resumed down direction
4H
Price is moving down indicated by MA down crossovers, Relative Strength Index at 46 moving downwards, volatility is low.
1H
MA are moving down, Relative Strength Index at 34, volatility is medium and the price is below middle Bollinger band.
Enter Short Sell based on trend for the daily chart which is short, RSI 33 and also all entry signals for H1 have been met.
Take Profit- at 100 pips between support1 and support2
Profit by Market Close: +33 pips
Why Trade Was Profitable
1H- MA for 1 hour heading down all day, MACD gave a sell signal after leaving overbought, RSI less than 50 and the price action direction on H1 was down, volatility was medium and Bollinger bands were pointing down.
Day- The daily MA were crossing over to signal a long trend but was a non-confirmation since the MACD showed short, RSI at 32, therefore this was just a retracement, the trade was opened when the price started to come down this was just a retracement.
4H- The retracement was already complete and the and the MA crossover system had already given a down crossover signal, Relative Strength Index was heading down and MACD also gave a short signal.
Page 2
USDCHF- Buy Long
Day
The trend is upwards based on RSI at 65 and MAs are flat, Bollinger bands are wide pointing up, volatility is high.
4H
Relative Strength Index at 50, stochastics leaving oversold, MA crossover has given an uptrend crossover signal.
1H
MA moving up, RSI at 64, stochastics heading upwards
Enter Long based on daily chart and all buy long signals have been met
Profit at Market close +45 pips
Why Transaction Was Profitable
H1- Ma for H1 headed up all day, MACD gave a buy signal after coming up from oversold, RSI was above 50 all day, volatility high and Bollinger bands going upwards.
Day- the daily MACD was bullish, the RSI was at 68 heading upwards, the market was retracing but had already started turning up, volatility was high with Bollinger bands heading up.
4H- Ma had an upward crossover signal, the Relative Strength Index was heading upwards, the MACD was above zero centerline mark, volatility was low.
Page 3
GBPUSD- Short Sell
Day
Day trend is short,RSI is at 23, the market has resumed downtrend after a retracement, big black Marubozu candlestick pattern.
4H
Price has turned down after retracement, RSI at 38, stochastics leaving overbought heading down and Moving Average Crossover system has given a short sell signal heading down.
GDP for Britain came out worse than expected, GBP Fundamentals and Technical Analysis = downtrend
Entry- Short based on Day and all sell signals rules on the 1H have been met
Profit at close +35 pips
Why Trade Was Profitable
1H- MA were heading down all day in a steep manner, the MACD had left overbought giving a sell signal all day, RSI stayed low at around 30, Fundamental indicators came out extremely bearish, volatility was high and Bollinger bands were pointing down.
Day- The Daily MA were to crossover but because of the retracement, headed right down again with a big black candle(250 pips), MACD was bearish, RSI at 22heading down and Bollinger bands pointing down, volatility was high.
4H- 4 hours chart the moving average had given a down crossover signal, MACD was below zero center line mark, Relative Strength Index was below 50.
Page 4
USDJPY- Buy Long
Day
The day trend is upwards, RSI at 52, stochastics heading upward and MA pointing sideways, the market has resumed upward direction after the retracement.
4H
MAs going upwards, stochastics leaving oversold region, RSI at 52
1H
MAs going up, RSI at 65, both stochastic heading upwards
Entry- Long based on Daily and all buy signals rules on the 1H have been met
Profit at close +64 pips
Why Transaction Was Profitable
H1- MAs were moving up all day, MACD gave a buy signal, RSI was above 50 volatility was high and Bollinger bands were pointing upwards.
Day- MACD was in bullish territory above zero center line, RSI was below 50 but pointing upwards, the MA were flat, Bollinger bands were pointing upwards and volatility was low.
4H- on the 4-hour chart, the moving averages had given a buy crossover signal, Relative Strength Index at 51 after crossing above the 50 centerline mark.
Profit at Market Close
EURUSD +33 Pips
USDCHF +45 Pips
GBPUSD +35 Pips
USDJPY +64 Pips
Total = 177 Pips
Why trades were profitable
Why transactions were profitable is because multiple time-frames analysis were used correctly and the direction of the price action was analyzed correctly by following the rules of my system as specified in the Forex plan.
Entry Rules in the 1 Hour timeframe had matched before opening of these orders
Fundamental Indicators were also used to predict some moves.
In Short - Today I stuck to all the rules of my system
Record Entries Explained Using Examples with Images
1.
EURJPY Sell Position 13-December-2011
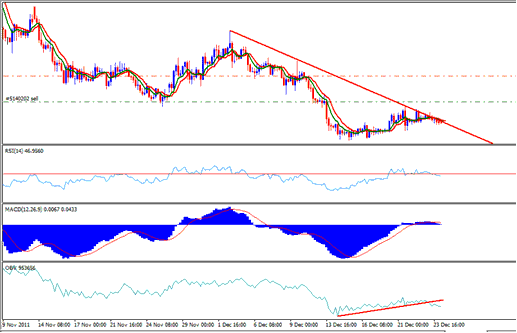
Position opened EURJPY Short Sell
Date: 12-13-2011
Chart Timeframe: 4 hr Chart
Why Transaction was opened
- Both MAs were moving downwards
- Relative Strength Index is below 50 Level, therefore, the currency is bearish
- MACD is heading towards Bearish Territory
- OBV has broken the upward trend line, therefore, direction is downward
The price is also touching the downward trend line, therefore, this would be a good place to sell the currency.
Closed
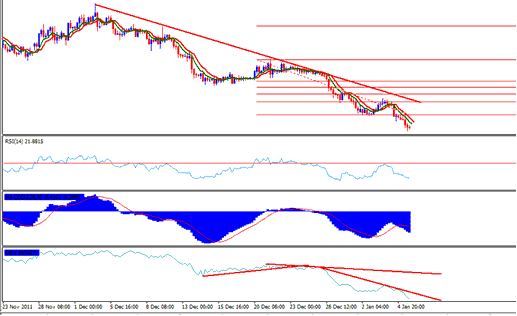
Closed by Taking Profit 300 Pips
Date: 01-02-2012
Why this position was profitable
It was profitable because the risk to reward ratio of this setup was very high.
The trade went back to its downwards after touching the downward trend line.
The OBV indicator is a leading indicator and when it broke its upward trend line it meant the price was going to go downwards.
After this leading signal, all the signals turned to show a bearish momentum and a bearish market.
2.
EURUSD Short Sell - 13-December-2011
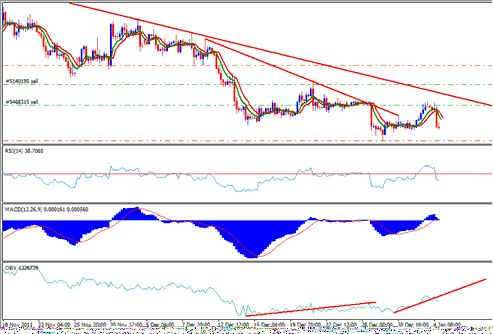
EURUSD Short Sell Signal
Date: 12-13-2011
Why Transaction was Opened
- Both of the MAs were heading downwards
- Relative Strength Index indicator is below 50 center line level
- MACD is heading downwards
- OBV indicator has broken its upward trend line
Closed
Closed by Take Profit 300 pips
Date: 01-05-2012
Why the transaction was profitable
All the rules of our system were followed before entering the short sell.
The long-term price action direction of the EURUSD is downwards as shown by the downwards trend lines.
Technical Analysis
There was a rally of the EURUSD which only went up to the previous resistance level, a good place to sell again. From the above diagram the first transaction has taken profit, the second one is still continuing.
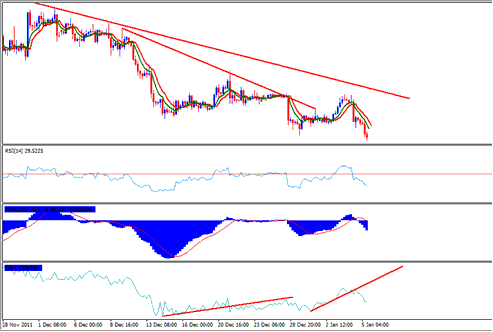
EURUSD Closed by Take Profit
3.
GBPUSD Short Sell - December-20-2011
Date: 20.12.2011
Position Opened – GBPUSD Short
Time-frame – 4-hour chart
Why Transaction was opened
- Both MAs are moving down
- RSI is below the 50 center-line mark
- MACD is heading down
- OBV has broken the upward trend and the market now is bearish.
A downward trend line can also be plotted on the price chart. This shows that rules of our system have been met and the market is bearish.
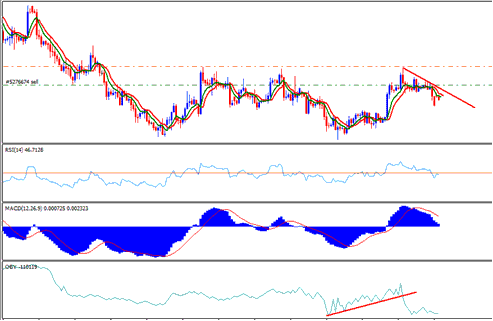
Take Profit – 300 pips
Stop Loss - 100 pips
Take Profit Hit
Closed by take profit
Date: 29.12.2011
Why This Position was Profitable:
All rules for the system were met before opening the transaction.
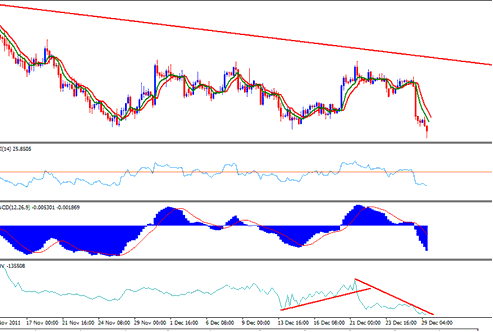
GBPUSD after hitting take profit.
4.
GBPJPY Sell - December-22-2011
Date: 22-12-2012
Opened: GBPJPY Short Sell
Time-frame: 4 hr chart time frame
Why the transaction was opened
- Both Moving averages moving down
- Relative Strength Index indicator below 50 center line level
- MACD indicator is heading down
- OBV has broken upward trend line meaning price will soon follow.
Since volumes always precedes price the price will break the upward trend line and start to move downwards. In addition, the longer-term price direction is a downward.
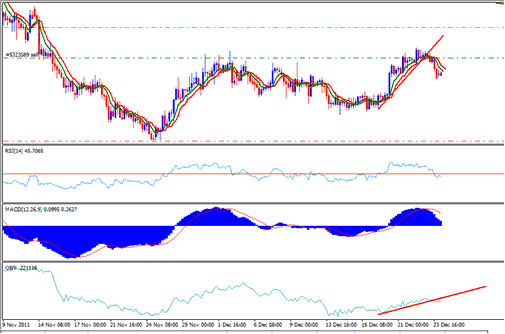
Closed
Closed by take profit (300 pips)
Date: 01-02-2012
Why This position was profitable
The long term trend is a downward.
All the rules of the system were followed before opening the position.
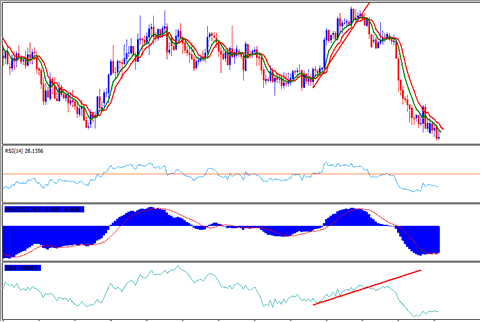
GBPJPY short sell closed after take profit.


No comments:
Post a Comment